The North Star framework is a strategic beacon that aligns your entire product team toward a singular, measurable and inspirational goal. It’s considered one of the best frameworks for driving focus and ensuring cross-functional alligment with a clear and shared destination. The North Star framework or a variation of it is used by successful product teams across the world.
This guide is a curated collection of the best resources available to learn more about the North Star framework. I try to provide additional pointers from my experience that have been left unsaid when I tried to understand how to best apply it for my product team.
I’ve heavily inspired and used resourced in this post form the referenced materials below:
North Star Playbook by Ampltidue
“Defining your North Star Inputs & Flywheels” a webinar by Ampltidue
“North Star Framework & OKrs” a webinar by Amplitude
“Choosing Your North Star Metric” by Lenny Ratchisky
Using the North Star metric
You might wonder why it’s necessary to learn about yet another framework when there are already so many available.
However, the North Star metric is not exactly a framework; it serves as a cohesive mental model that guides your product direction, aligning all product functions towards a unified goal.
Rather than being overwhelmed with questions about quarterly OKRs, progress, and the ultimate destination, the North Star metric offers teams and companies a relatively consistent approach to thinking.
As defined by the startup investor Sean Ellis:
“The North Star Metric (NSM) is a powerful concept that has emerged in recent years from Silicon Valley companies with breakout growth. It helps teams move beyond driving fleeting, surface-level growth to instead focus on generating long-term retained customer growth.
The North Star Metric is the single metric that best captures the core value that your product delivers to customers. Optimizing your efforts to grow this metric is key to driving sustainable growth across your full customer base.”
Having a well-defined North Star Metric can bring immense benefits in terms of focus and clarity. With different departments like sales, marketing, product, customer success, and engineering all contributing to delivering value to customers, it’s crucial to avoid becoming siloed, as this can disrupt the overall customer experience. By establishing a shared metric that aligns all teams with the mission, it becomes easier to concentrate growth efforts and work collaboratively towards a common goal.
When applied effectively, it represents a balance between customer needs and business value, providing a clear focus on where to head and how to ensure success.

Image source: John Cutler, cuttlefish.substack.com
If we were to look at a few examples of known companies and their potential North Star metrics the list would most likely look something like this:
Airbnb
North Star metric: Nights booked
Strategy: Optimise the number of transactions
Reasoning: As a two-sided marketplace (the hosts and the guests) by focusing on the number of nights booked Airbnb not only places the value on satisfying both of their user bases but also nicely ties in their business outcomes as they earn a percentage fee anytime someone books on their platform
Netflix
North Star metric: Median View Hours per Month
Strategy: Optimise Depth of Engagement
Reasoning: A pretty straightforward example here, you pay Netflix to watch TV shows/movies, the more you watch the more likely you are to renew your subscription or even possibly upgrade to a higher tier.
Slack
North Star metric: Number of messages sent
Strategy: Optimise depth of Engagement
Reasoning: The more messages you send, the more your team communications are happening over Slack and the more likely you are to invite other team members to contribute.
What makes a good North Star metric?
By looking at these examples of North Star metrics, once you see them they become instantly obvious. But when tasked to come up with your own, there are a few handful guidelines that will help you to stay in the right direction.
The North Star metric is something that:
- Measures the value your product brings to users.
- Is aligned with your current product strategy
- Is a leading indicator of revenue
- You are able to track and measure it
- Is simple enough for anyone to understand it
- Is actionable
Measures the value your product brings to users
When the North Star metric changes, we know that the change is meaningful. Try to avoid “vanity metrics”. Metrics like “# of app opens” or “app downloads” tell you nothing about the value your customers are getting out of your product
Netflix measures how much time users spend viewing their content because that is exactly what the users come to Netflix for.
Airbnb tracks how many booking have been made since that is their core value proposition.
Consider various scenarios where prioritizing the growth of a specific metric could lead the team to act in ways that might be detrimental to the long-term interests of the business.
For instance, if the chosen North Star Metric is “average monthly revenue per customer,” the fastest approach to boost this metric might involve eliminating customers with relatively low value, even if they are profitable for the company in the long run.
You want to focus on something that measures a core value exchange between your product and your users. When you know if you drive this metric up, the more your users have benefited from your product.
Is aligned with your current product strategy
One common mistake I made was assuming that the North Star metric should be an all-encompassing, unchanging measure that remains true for the next five years.
While this approach might be suitable for later-stage companies, it’s essential to recognize that for early-stage companies, it is entirely acceptable for the product strategy to evolve within a timeframe of about 6-12 months, and consequently, the North Star metric may evolve as well.
A valuable tip I can offer is to address the question: “What is the most pressing challenge we are facing right now?” Ideally, use that challenge as your North Star.
In essence, the North Star metric should be adaptable to the current stage of your company and the challenges it faces.
Companies usually have three main “strategies” that they might want to deploy:
- Optimise for Engagement
- Optimise for Growth
- Optimise for Monetisation
As you change your strategy based on your goals, most likely your North Star metric will also change.
Is a leading indicator of revenue
Revenue is a lagging metric that you cannot measure on a weekly basis. It is also a very noisy metric that is very hard to influence. Emphasizing revenue as the primary metric can lead to short-term thinking and prioritization of quick wins over long-term value creation.
As Sean Ellis puts it:
Revenue growth is very important, so this is a natural question that many people ask (especially CEOs). The challenge is that if revenue growth outpaces growth in the aggregate value that your product delivers to customers, it will not be sustainable. Revenue growth will eventually stall and start to decline. But if we can continue to grow aggregate value delivered to customers over time, then it becomes possible to sustainably grow revenue. Of course, CEOs will want to track both numbers because sustainable revenue and profit growth tend to be the metric by which they are judged by their investors and board members.
Finally, the North Star Metric becomes particularly powerful if the team associates it with the overall company mission. Facebook does an excellent job of connecting its NSM (Daily Active Users) to their mission of “bringing the world closer together.”
You are able to track and measure it
One of the primary advantages of having a North Star metric is the ability to gauge the performance of your product, especially in terms of the impact of product launches—whether they have improved, worsened, or had no significant effect on the product.
Hence, it is crucial to have a measurable North Star metric. However, it’s essential not to become overly fixated on finding the perfect metric.
Consider the case of Google Calendar, where the ultimate purpose of the product is to “organize your time,” and the ideal measure of success would be to track how many events from your calendar you have actually attended in real life.
Nevertheless, this kind of measurement is challenging, if not nearly impossible. Instead, Google Calendar most likely focuses on measuring how many event invites you have accepted.
If you consistently accept invites, it suggests that the product is working effectively for you.
Start by defining the game your company is playing
Based on research done by Amplitude of products at over 12,000 companies and 5 trillion user actions they learned that:
“All digital products play one of three possible games of user engagement. They’re either playing to win attention, transaction, or productivity”
The Attention Game: Products playing this game are trying to maximize the amount of time users spend in-product. Industries that typically play this game today are media, gaming and any company displaying advertisements to you.
The Transaction Game: Products playing this game help customers make purchase decisions with confidence. Companies you will often find playing this game are e-commerce platforms.
The Productivity Game: Products playing this game create an easy and reliable way to complete an existing task or workflow for the user. This game is predominant in business-to-business software.
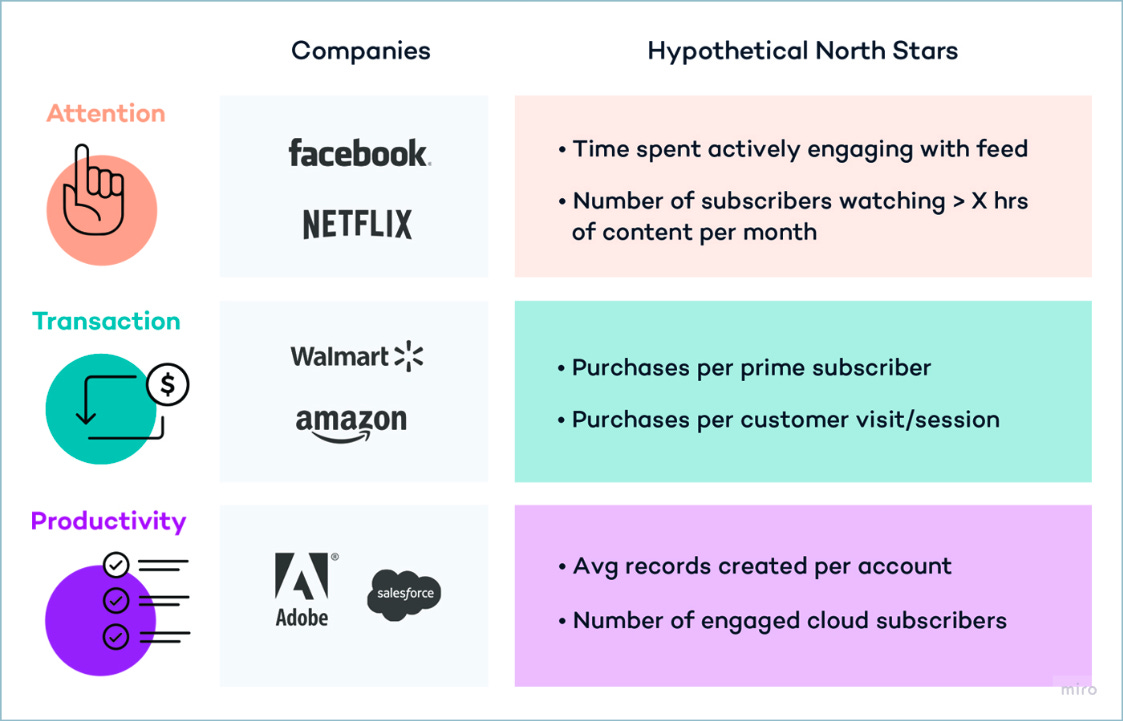
If you’re in the Attention game then this statement should resonate with you the best:
Our business benefits directly if customers spend more time with our product.
We want customers’ mindshare.
Customers use our product to read, watch, listen, and play.
If you’re in the Transaction game then this statement should resonate with you the best:
Our business benefits directly if customers participate in the economy using our product.
We want customers’ wallets.
Payments and commerce are important to us.
Customers use our product to purchase, order, measure, transact, and track.
If you’re in the Productivity game then this statement should resonate with you the best:
Our business benefits directly if customers efficiently accomplish tasks using our product.
Efficiency and achievement are important to us.
Customers use our product to make, work, complete, configure, and build.

The Next Step, defining inputs
Once you have an idea of what your North Star metric might be, the next step is to understand how can you influence it.
When you have defined your inputs, it will become a lot clearer what sort of initiatives you need to take on to start influencing your north star metric and drive business outcomes.
Another benefit of having inputs for your North Star is that you’ll be able to measure your progress a lot quicker and understand where the “lowest hanging fruit” lies.
A great thought exercise on how to think about your inputs would be to try to create a formula for your North Star.

Let’s look at Spotify and try to work through potential inputs that they might be looking at.
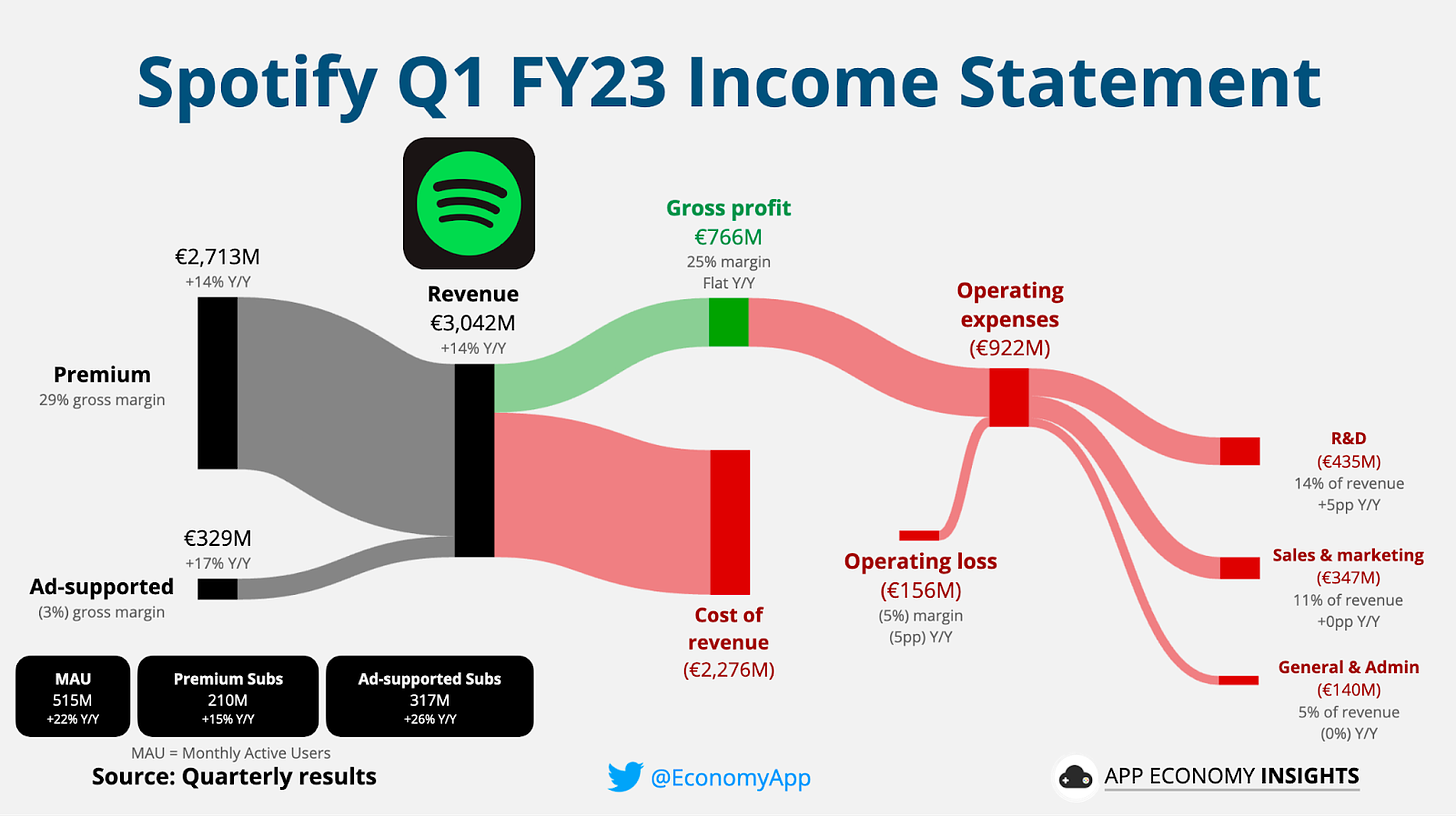
If we assume that this breakdown is correct, then Spotify earns about 90% of its revenue from its premium subscribers rather than their free-plan users.
Where their premium users on average spend 75 hours per month listening to music vs their free users spend 25 hours per month.
Now Spotify is not optimising the number of transactions you make nor is it trying to make a specific task in your day easier to complete, Spotify is playing the attention game.
Just like with Netflix, the more time you spend on their platform the more likely it is that you will renew your subscription or upgrade from the free plan. And by looking at the revenue percentages between free and paid users we can go ahead and say that a potential North Star metric for Spotify could be
Time spent by paid subscribers listening to music
Note: Spotify has recently heavily invested in their podcasting platform as well, and most likely have a different north star metric for their podcasting offerings, but for the sake of this case study lets keep it simple and focus on their basic service
So if we were to breakdown Spotify’s North Star metric further we would get these potential input metrics
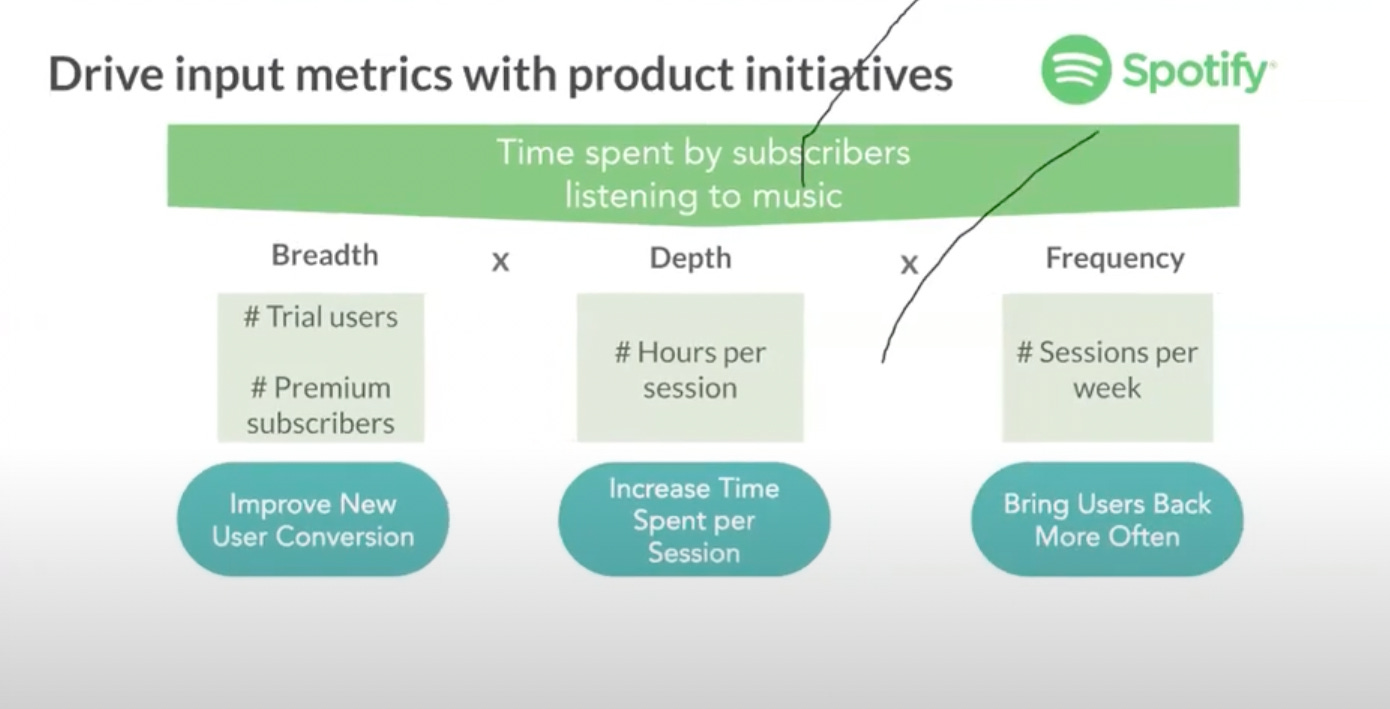
And by doing so we not only have a clear North Star metric to follow but also clear sub-inputs like “User conversion rate”, “Time spent per session” and “# of sessions per week” that we can track and try to influence through product initiatives.
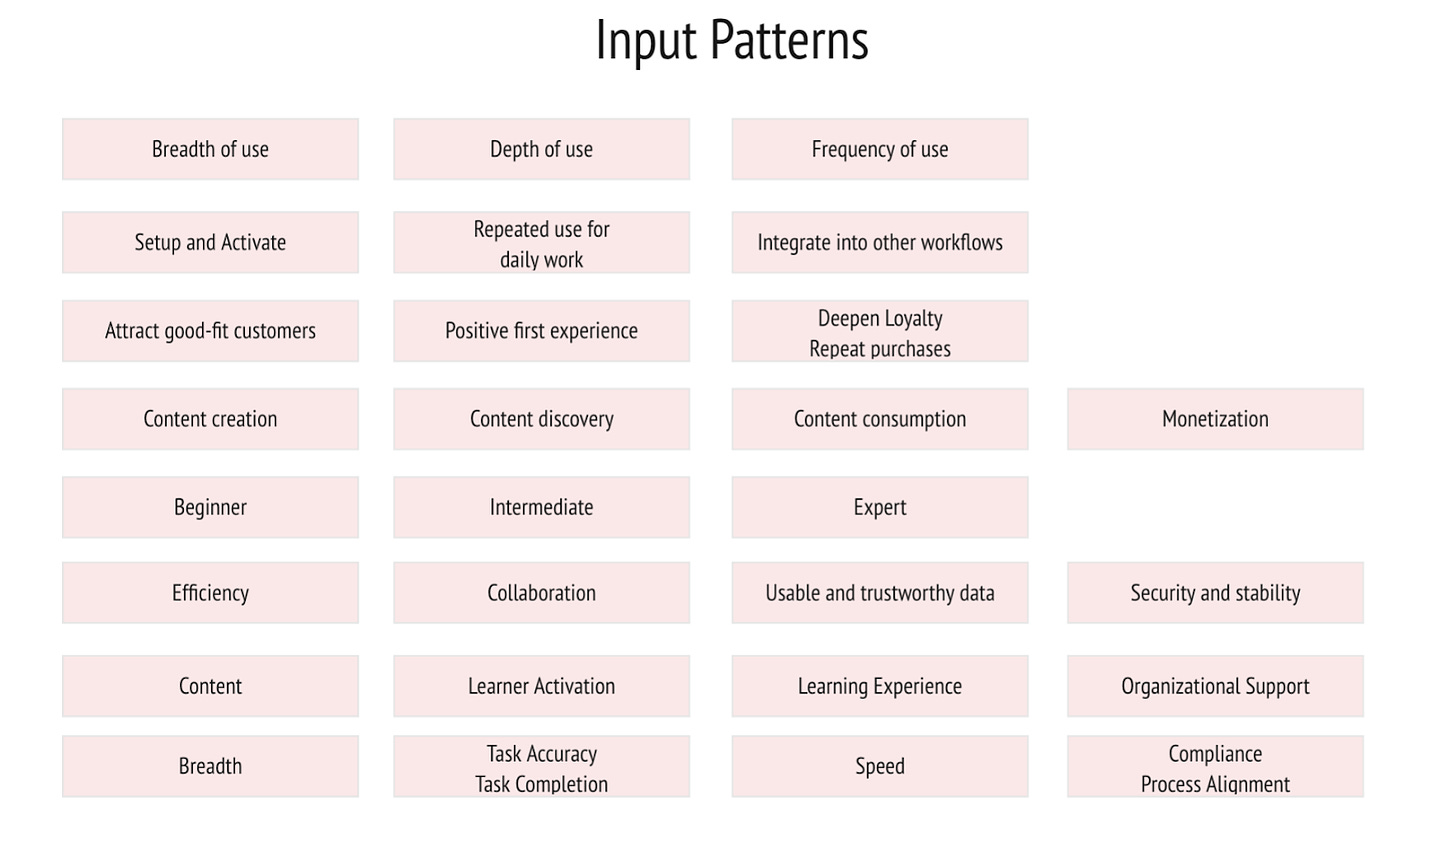
The Breath, Depth and Frequency inputs are just an example of what good inputs might look like, but these specific inputs might not work for your North Star or product. Thankfully the good folks at Amplitude have done hundreds if not thousands of these workshops and have created a list of input patterns that they have noticed emerge from their workshops.
Case study
Let’s try to work through a few examples on defining a North Star metric for other companies to better try to understand how the North Star metric works.
Coda.io
What is the mission of the product?
“Bringing words, data, and teams together” Coda aims to combine all your team docs into a single space, focusing more on B2B use cases than individual B2C
What is the business outcome?
Coda is a freemium model, where a free “workspace” can create as many docs as they like, but each doc has a limited size. Once any of your docs reaches that size you are asked to upgrade to paid plan. You are billed for the number of “Doc Makers” in your organisation.
On the paid plan coda only charges per Doc Maker, editing and viewing docs is free.
From a pure business standpoint, Coda is interested in
- Increasing the number of Doc Makers per workspace
- Increasing the number of paid workspaces
From their unique pricing point where editing a doc is for free, we can also safely assume that they are focusing on sharing the documents with as little friction as possible.
What are the key users’ actions/flywheel?
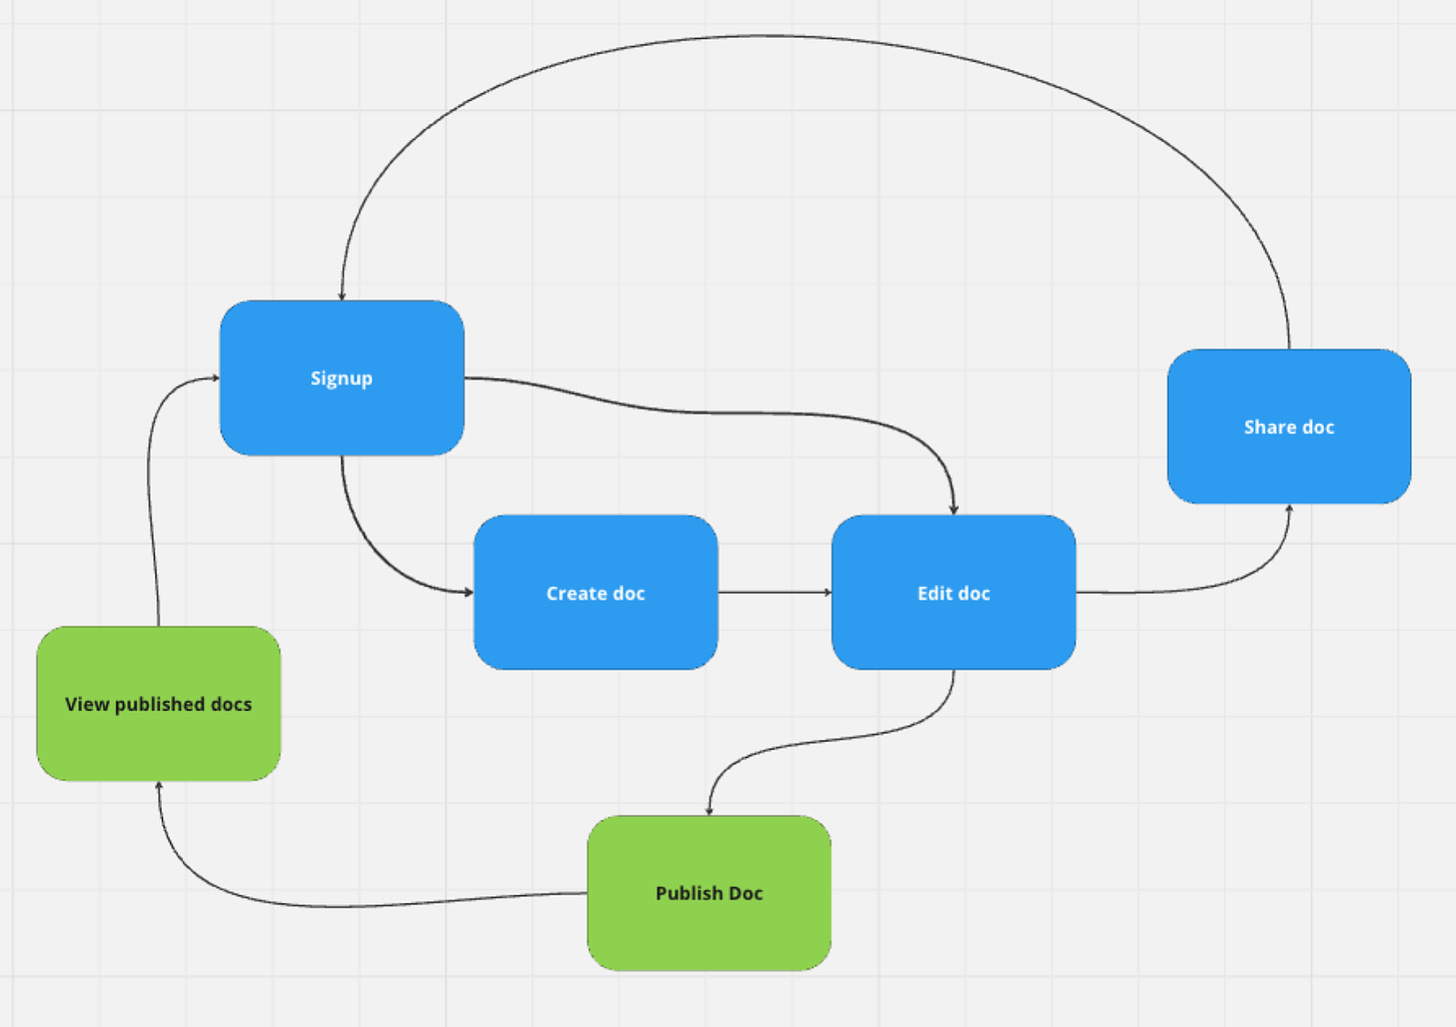
If we analyse Codas user journey we can see that we have two loops happening, the basic sharing loop that prompts adoption within your organisation, and the viral organic loop that aims to bring more awareness to coda through public doc sharing.
What game is Coda playing?
It’s pretty safe to say, that Coda is a productivity tool and that they’re playing the Productivity game, concerning themselves with creating an easy and reliable way to create, share and edit docs.
What is the key focus for Coda right now?
Looking at the flywheel we can see that the intersection kicking off both the sharing loop within your own organisation and the global sharing is doc editing.
The more users edit a document the better the chances that they will share it with their team and/or create something that they’re proud of and share it as a template.
Since Coda works as a SaaS business with a monthly subscription, just looking at the active editors might not paint the whole picture for them. They might be able to bring a lot of new users editing docs on day 1 and then experience massive churn.
Since Coda aims to replace other productivity tools teams commonly use (Sheets, Google Docs, Trello, etc) they want to make sure that users adopt Coda in their daily workflows.
So Coda’s north star metric might be something along the lines of “Day 14 Daily Active Editors”
Leave a Reply