Did you know that when you use Mixpanel cohorts to analyze trends month by month it will often count one user with the same event in two different months?
After noticing that some of the data was not behaving how i expected to, i reached out to their support team to get to the bottom of it.
Here are the main takeways.
What are cohorts in Mixpanel?
Mixpanel’s Cohorts feature allows you to group users based on shared characteristics or actions.
You can define these cohorts visually, see the user lists, make comparisons, and share them with your team.
Some examples include:
- ‘US Users,’
- ‘New Users,’
- ‘Power Users,’
- ‘Dropped-Off Users.’
Cohorts enable you to focus your analysis on specific user groups, such as those who performed a particular action within a specific time frame, like ‘users who watched a video for the first time in the last 30 days.
The last 30 days refer to a dynamic time frame that adjusts depending on when you access the cohort.
What was I trying to achieve
I wanted to analyze users who, after sending their first message ever, returned to send another message on a different day within 30 days.
While I could have used the retention report for users who sent messages on a second day, I was also curious about those who did it on 3 or 4 different days.
While I could have used the retention report for users who sent messages on a second day, I was also curious about those who did it on 3 or 4 different days.
So, as a test I created two cohorts:
- “Users who sent a message for the first time in the last 30 days.”
- “Users who sent a message on two different days in the last 30 days and also sent a message for the first time in the last 30 days.”
To calculate the percentage, I divided the first cohort by the second, and there I had my report.
The discrepancy
I compared my report with Mixpanel’s basic retention report and noticed discrepancies. I reached out to Mixpanel support, and the answer I received is the focus of this post.
It turns out that when you use Mixpanel cohorts to analyze trends month by month, the way they calculate user numbers per month isn’t straightforward.
Lets take a basic of example of our first cohort “Users who sent a message for the first time ever in the last 30 days”.
Here’s a simplified explanation:
- Mixpanel checks each date for each month to see which users qualify for the cohort (i.e., which users did the event in the last 30 days in the first day of the month, the second day and so on).
- This process repeats for each day in the month for every month in the report
If we plot this cohort on a graph this is what we would get
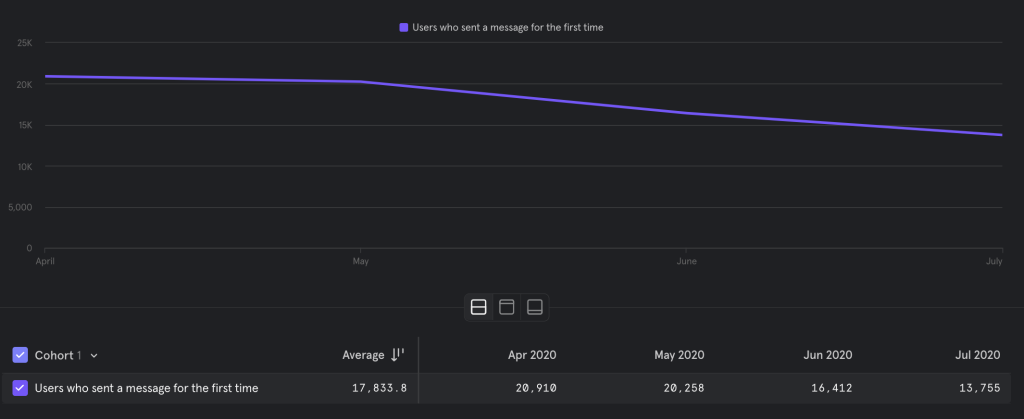
Where we would expect that each month represents the amount of users who have sent a message in the last 30 days for the first time.
However its not that straightforward so lets try to understand how Mixpanel comes up with their user count for June.
However its not that straightforward so lets try to understand how Mixpanel comes up with their user count for June.
Mixpanel starts by examining each day of the specified month, like June 1st, to identify users who meet the cohort criteria (e.g., those who performed an event in the last 30 days). This process continues for each day until the end of the month.
To illustrate, let’s consider a user who shared their first post on June 10th.
This user qualifies for both the June and July cohorts because, if you look back from, say, July 5th, they did perform the event in the last 30 days.
As a result, this single user for their single event is counted in both the June and July cohorts.
Now, remember what I was trying to achieve: analyzing the percentage of users who send another message within 30 days of their first one.
Let’s simplify further by imagining I have only one user who sent their first message on the 10th of June and their second message on the first of July.
- In June:
- Number of first-time messages sent: 1
- Number of second messages sent within 30 days: 0
- Percentage of users who sent a second message within 30 days in June: 0%
- In July (for the same user with the first event on June 10th):
- Number of first-time messages sent: 1
- Number of second messages sent within 30 days: 1
- Percentage of users who sent a second message within 30 days in July: 100%
If the user had sent their second message on June 25th, the percentages would be:
- June: 100%
- July: 0%
Which is fine if all I care about is the general trend of user conversion.
I am still able to see whether or not the percentage goes up or down, but it would become quite hard for me to make quick decisions based on the data month to month, but that’s not the point of this article.
The key takeaway is that I worked with Mixpanel cohorts for some time without fully grasping this aspect, and I hope this post helps you avoid similar confusion